With hundreds of millions of ratepayers and taxpayers money going into public transport, the question is, are we getting value for money?
Memorandum
To: Mayor and Councillors
From: Michael Lee, Auckland Councillor.
Date: 7 May 2015
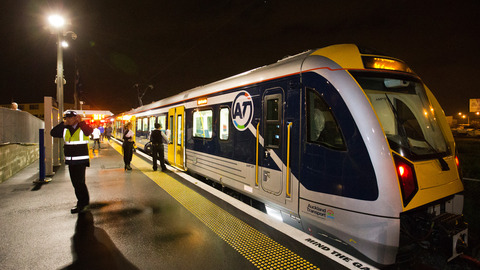
Subject: Rail Operating Costs
I am providing this memo at the request of the Budget workshp of 6 May. I have periodically raised with Councillors and management serious concerns I have about the sharply increasing levels of operational costs of commuter rail and whether this is justified and ultimately affordable. I have raised these concerns with the Auckland Transport Board in my role as a director. Given the far-reaching rating decisions that are required to be made by the Council for the Long Term Plan, this matter is of material interest to the Governing Body.
Attachment 1 to this memo outlines a comparison between rail operations in Auckland and Wellington. Overall, while the two systems carry a broadly similar number of passengers (Auckland has pulled ahead in the past year), the Auckland rail network had a gross cost to operate of around $139m per year (2013/14), whereas Wellington’s gross cost is just over $85m for the same year. Furthermore, fare revenue received in Wellington is over $43m while in Auckland it’s just over $30m. Overall this leads to some major differences in the net cost per passenger of rail in Auckland and Wellington, as summarised below (2013/14 data):
| Auckland | Wellington | |
| Total subsidy per passenger | $9.37 | $3.68 |
| Total subsidy per passenger km | $0.65 | $0.16 |
As explained further in attachment 1, I do not believe there are any fundamental reasons why the net cost of rail in Auckland should be more than twice that of Wellington on a per passenger basis. The introduction of electric trains and integrated ticketing should be driving down the cost of providing rail service in Auckland ( as predicted in the business cases for both these projects) yet this is not reflected in the total operational cost we are providing each year to Auckland Transport which continues to increase significantly.
I therefore propose an additional recommendation as part of our LTP decision-making process to encourage Auckland Transport to deliver better value-for-money from rail operational costs. If there are significant savings to be found in this area then that enables a lower level of rates increase in future years of the LTP, and frees up more funding for further investment in transport. My proposed recommendation is outlined below:
That the Budget Committee notes the significantly higher rail operating costs for Auckland compared to Wellington and requests the Chief Executive to work with Auckland Transport and report back on options for potential savings in these costs as part of developing the 2016/17 Annual Plan.
Attachment 1 – Comparison of Auckland and Wellington rail operating costs
Please find the results of bench-marking between Auckland and Wellington commuter rail operations. The key figures are publicly available in detail in the Wellington Metropolitan Rail 2013/14 Annual Report released in December 2014. Auckland’s figures are extracted from the Summary of Financial Results 29th July 2014 (AT Board open agenda).
| Auckland | Wellington | |
| Pax boardings per year June 2014 (m) | 11.435m | 11.6m |
| Fare revenue received | $30.63m | $43.26m |
| Fare received-per-recorded boarding (average) | $2.68 | $3.72 |
| Total Operating Costs (Including security) | $139.285m | $85.09m |
| Farebox Recovery | 22% | 50% |
| Ratepayer Subsidy ($m) | $43.3m | $18.84m |
| NZTA Subsidy ($m) | $63.92m | $23.9m |
| Total Subsidy rates & NZTA ($m) | $107.2m | $42.74m |
| Total Subsidy per passenger | $9.37 | $3.68 |
| Total passenger km (m) | 165.5m/km | 274m/km |
| Opex per passenger km ($) | $0.84 | $0.32 |
| Fare per passenger km ($) | $0.19 | $0.16 |
| Subsidy per passenger km ($) | $0.65 | $0.16 |
Please note that despite almost identical numbers of passenger boardings recorded in year ended June 2014, the cost/revenue disparity between the two operations: Wellington Regional Council/KiwiRail and Auckland Council/Auckland Transport Transdev/Kiwirail, has increased markedly since my previous benchmark exercise in March 2014.
Note Wellington’s station train security costs ($1.711m) are declared in the WRC Metropolitan Rail Annual Report, whereas Auckland’s are commercially confidential and so I have not detailed them. However they are significantly higher than Wellington’s both in real terms and proportionately given the similar numbers of passengers carried. Auckland train/station security costs are increasing significantly.
Please note the total operating cost differential between the two operations (gross figures) over two financial years 2012/13 and 2013/14:
2012/13. Auckland $116.06m.Wellington $81.20m.Auckland $34.86m more costly (ie 43%) more costly than Wellington.
2013/14.Auckland $139.285m Wellington $85.09m.Auckland $54.20 million more costly (ie 61%) more costly than Wellington (for a very similar amount of recorded passenger boardings).
In regard to revenue received, the difference is:
2012/13. Auckland. $27.13m. Wellington $40.40m
2013/14.Auckland $30.63m. Wellington $43.26m
Therefore in 2013/14, Auckland’s train fare revenue received was $12.63 million (29.2%) less than Wellington’s for a similar number of recorded passenger boardings.
Net figures. Deducting revenue from total operating costs reveals a greater disparity.
2012/13. Auckland net costs: $88.93. Wellington net costs $40.80m.
Auckland net costs $48.13 million more than Wellington.
2013/14. Auckland net costs $108.66m. Wellington net costs $41.82m.
Therefore Auckland’s net costs are $66.84 million more than Wellington’s. That is 2.6 times that of Wellington’s – or to express it differently – the net coperational costs of Wellington rail would need to increase by 160% per year to be at the same level as Auckland.
Netting out these figures not only compounds the significant cost difference but also reveals a major revenue disparity. In other words Auckland not only has a cost problem it also has an apparent major revenue loss problem.
In a report to the AT Board last year management stated that ‘many key differences will be mitigated when Auckland introduces a new electric fleet of trains.’ Management also pointed to the ‘mature’ nature of Wellington’s public transport usage and also pointed to ‘topographical differences’ between the two cities. The weight placed on the last two points is however debatable when it comes to proportionate cost and revenue numbers. However it is fair to say Wellington’s electric service is fully operational while Auckland’s is not yet completely rolled out. But it is important to remember Wellington also runs diesel SA/SD type trains (SW) on the Wairarapa line and to Palmerston North and diesel operations in Wellington will continue for the forseeable future. The actual fuel & traction cost differences for 2012/13 (last figures available) were Auckland $11.29m and Wellington $4.2m – Therefore Auckland’s fuel/traction costs were just over $7m more than Wellington’s. But even the if there was elimination of fuel/traction costs differences with the full roll out of Auckland electric trains, this will make only a marginal difference to the overall cost disparity.
More significant are ‘labour’ cost differences revealed in 2012/13 (I do not have more recent figures): Auckland $44.2m. Wellington $25m. ‘Labour’ costs for Auckland’s operation in 2012/13 were $19.2 million more than Wellington’s.
This labour cost differential persists and is difficult to explain given Wellington has a manual ‘clippy’ staff system and Auckland has a full automated smart card system but (and I think this is absolutely critical to the whole problem), only three stations, Britomart, Newmarket and Manukau are gated. Most telling are the fare box recovery figures: Auckland 22% Wellington 50%. This is slightly down from 2012/13 (Auckland 23.3%, Wellington 50%). Government expectations are that fare box ratios should be 50% but Auckland has been moving in the opposite direction. Fare increases, especially those of two and three years ago, were corelative with a lower fare box ratio, presumably because of higher evasion and a period of patronage decline.
In 2010/11 Auckland’s rail operating costs were $56.1m. Opex costs for the current 2014/15 are budgeted to be $158.668m. Patronage for 2010/11 was 10.3m pax, the current year’s patronage is likely to be 13.5m.
Summary
The issue of significant cost/revenue differences between the Auckland and Wellington commuter rail operations appear to be systemic and is suggestive of much more detailed analyses to explain them. However two simple facts are clear. The Auckland commuter rail operation has a major cost problem as well as a significant revenue loss problem. A similar benchmark exercise for year 2014/2015 is likely to reveal an even greater disparity between the cost of Auckland and Wellington operations and raise questions about the ultimate sustainability of these costs which ultimately fall on Auckland ratepayers and taxpayers. It would not be unreasonable to ask in light of the circumstances, are ratepayers and taxpayers getting value for money from this service?
Please find link to the Greater Wellington Metro Rail annual report:
http://www.gw.govt.nz/assets/council-reports/Report_PDFs/2014.648a1.pdf